
Things to fix for database building
Clean up the github repo
link : https://github.com/jiyeoon/GSOC_proj
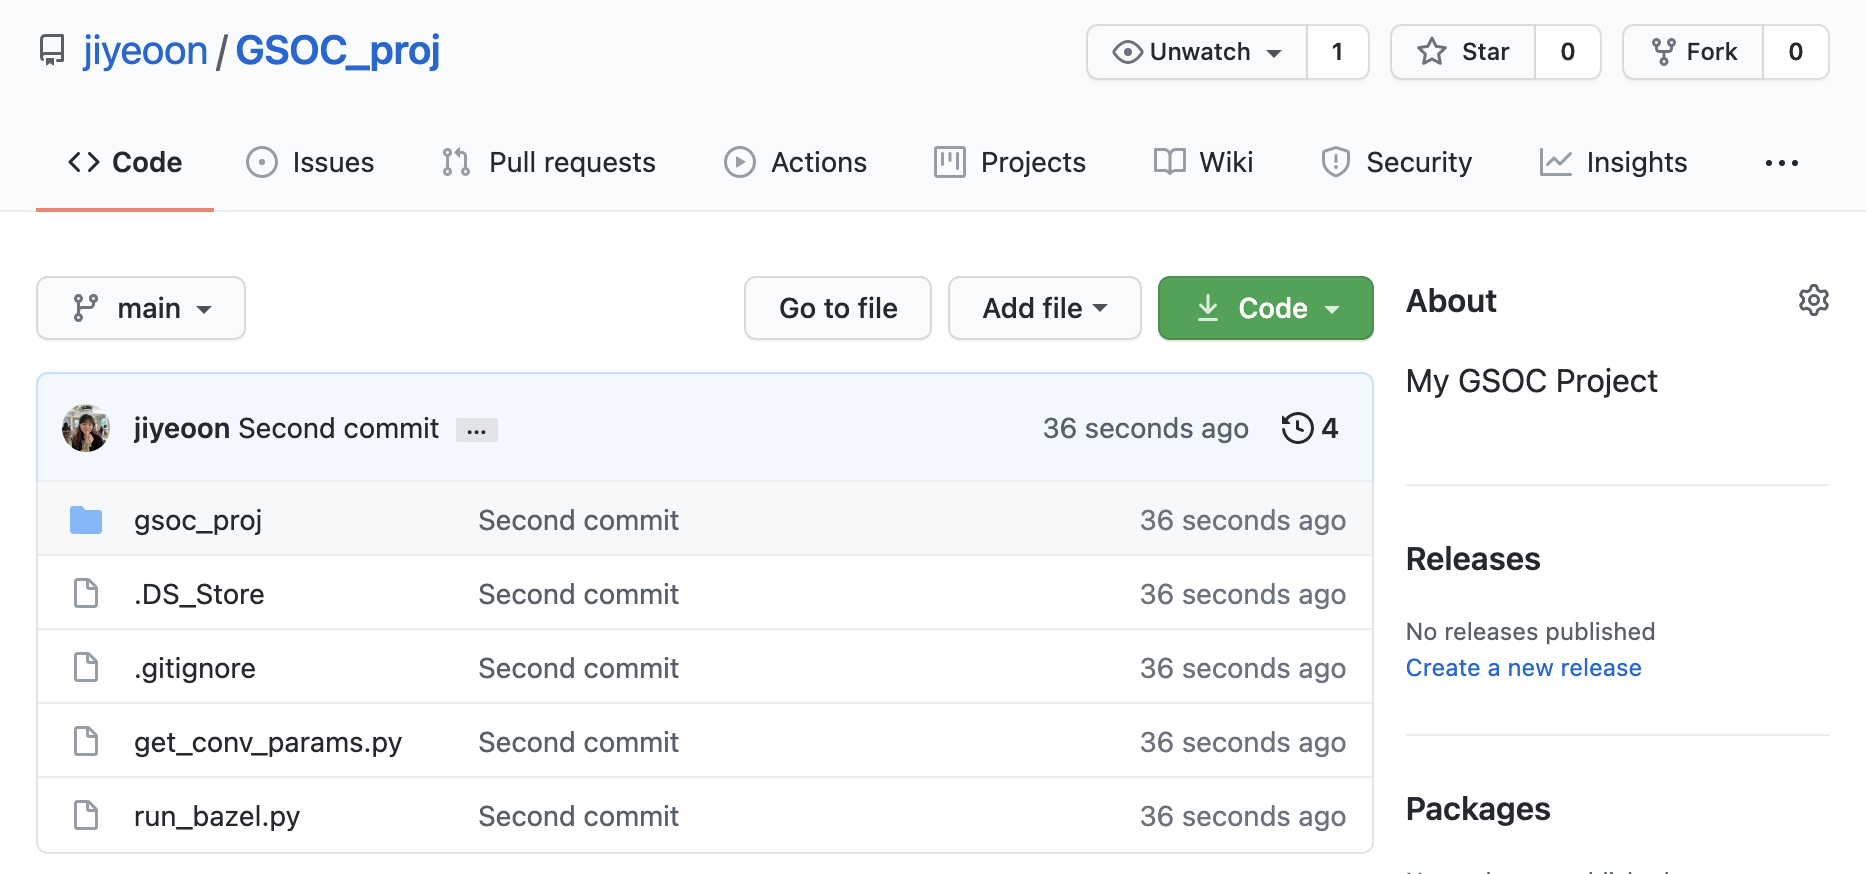
First of all, I have only uploaded files that I created/modified. I’m not sure it is okay.
What files should be included specifically?
Metric
There are 3 main metrics for model evaluation in regression.
1. R Square (-> our current model’s metric)
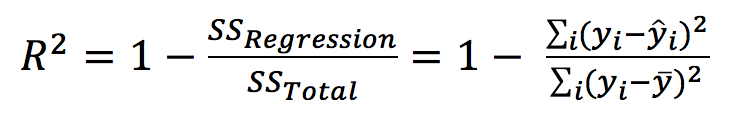
R Square is calculated by the sum of squared of prediction error divided by the total sum of the square which replaces the calculated prediction with mean. R Square value is between 0 to 1 and a bigger value indicates a better fit between prediction and actual value.
R Square is a good measure to determine how well the model fits the dependent variables. However, it does not take into consideration of overfitting problem. If your regression model has many independent variables, because the model is too complicated, it may fit very well to the training data but performs badly for testing data. That is why Adjusted R Square is introduced because it will penalize additional independent variables added to the model and adjust the metric to prevent overfitting issues.
2. Mean Square Error (MSE) / Root Mean Square Error (RMSE)
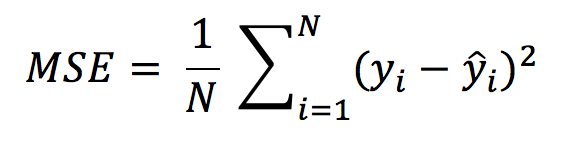
While R Square is a relative measure of how well the model fits dependent variables, Mean Square Error is an absolute measure of the goodness for the fit.
MSE is calculated by the sum of square of prediction error which is real output minus predicted output and then divide by the number of data points. It gives you an absolute number on how much your predicted results deviate from the actual number. You cannot interpret many insights from one single result but it gives you a real number to compare against other model results and help you select the best regression model.
Root Mean Square Error(RMSE) is the square root of MSE. It is used more commonly than MSE because firstly sometimes MSE value can be too big to compare easily. Secondly, MSE is calculated by the square of error, and thus square root brings it back to the same level of prediction error and makes it easier for interpretation.
3. Mean Absolute Error (MAE)
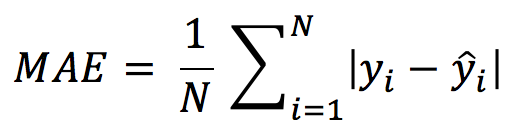
Mean Absolute Error(MAE) is similar to Mean Square Error(MSE). However, instead of the sum of square of error in MSE, MAE is taking the sum of the absolute value of error.
R Square/Adjusted R Square is better used to explain the model to other people because you can explain the number as a percentage of the output variability. MSE, RMSE, or MAE are better be used to compare performance between different regression models.
Reference : What are the best metrics to evaluate your regression model
Very Simple EDA
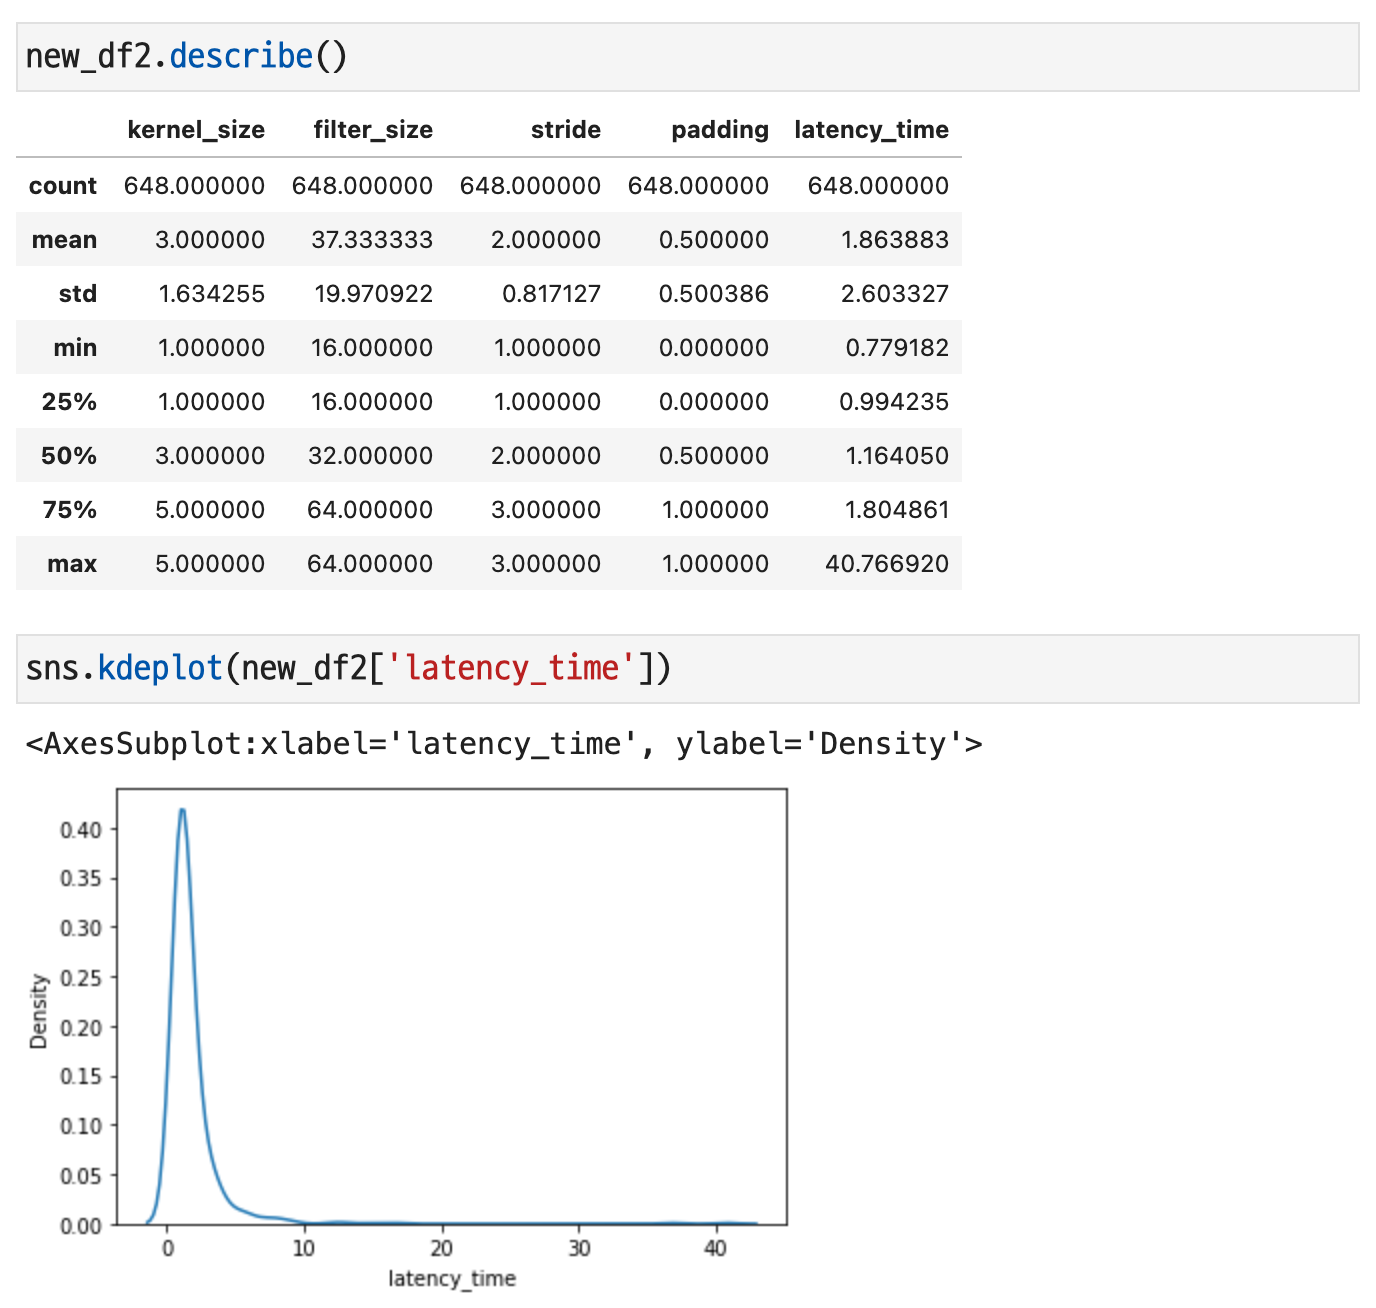
The distribution of latency time is as above.
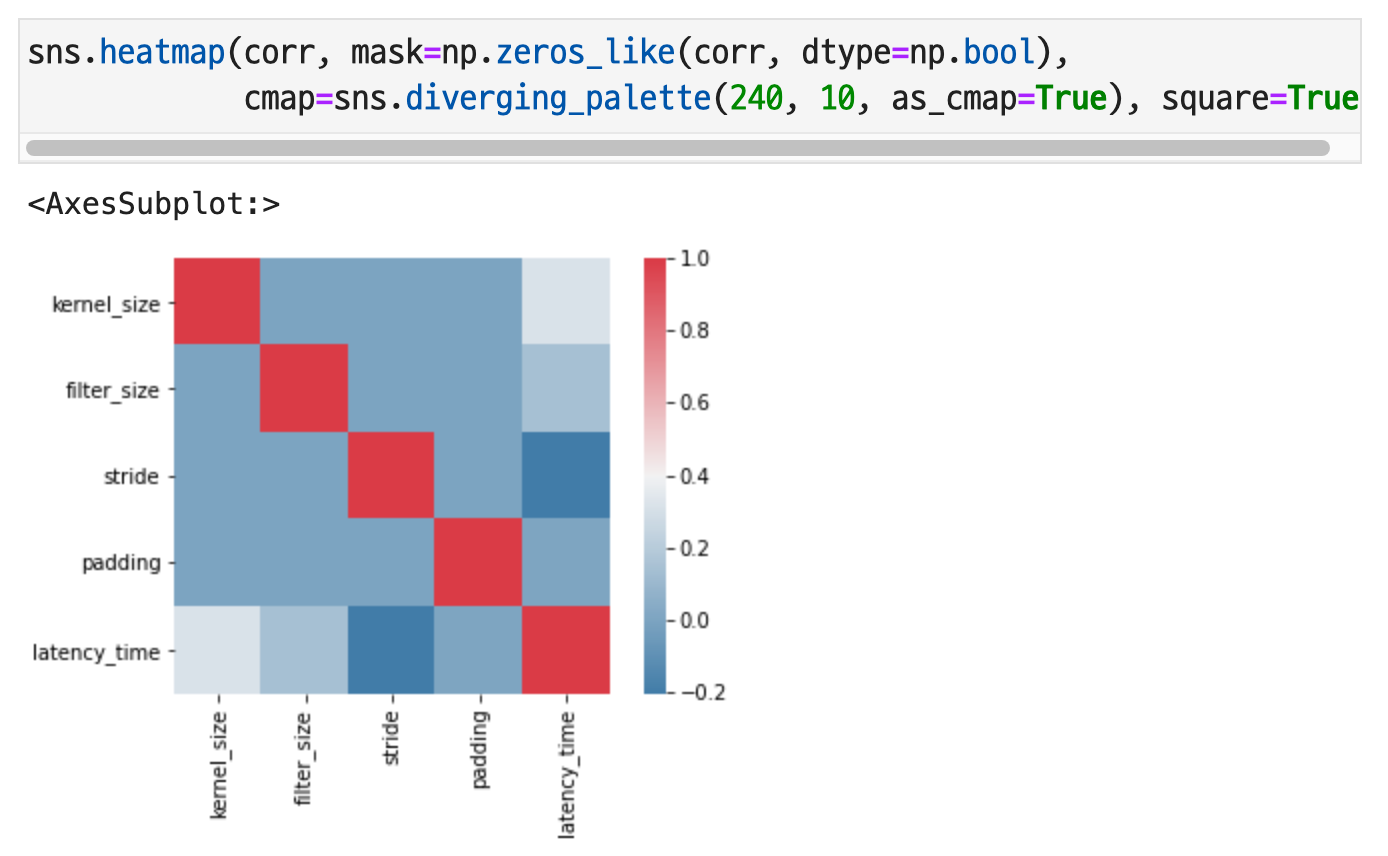
I checked the correlation for each variable. There were not many variables that were more correlated with latency time than expected.
Testing database must be genenerated out of some real model
For starters, I thought about how to know each layer of the actual models.
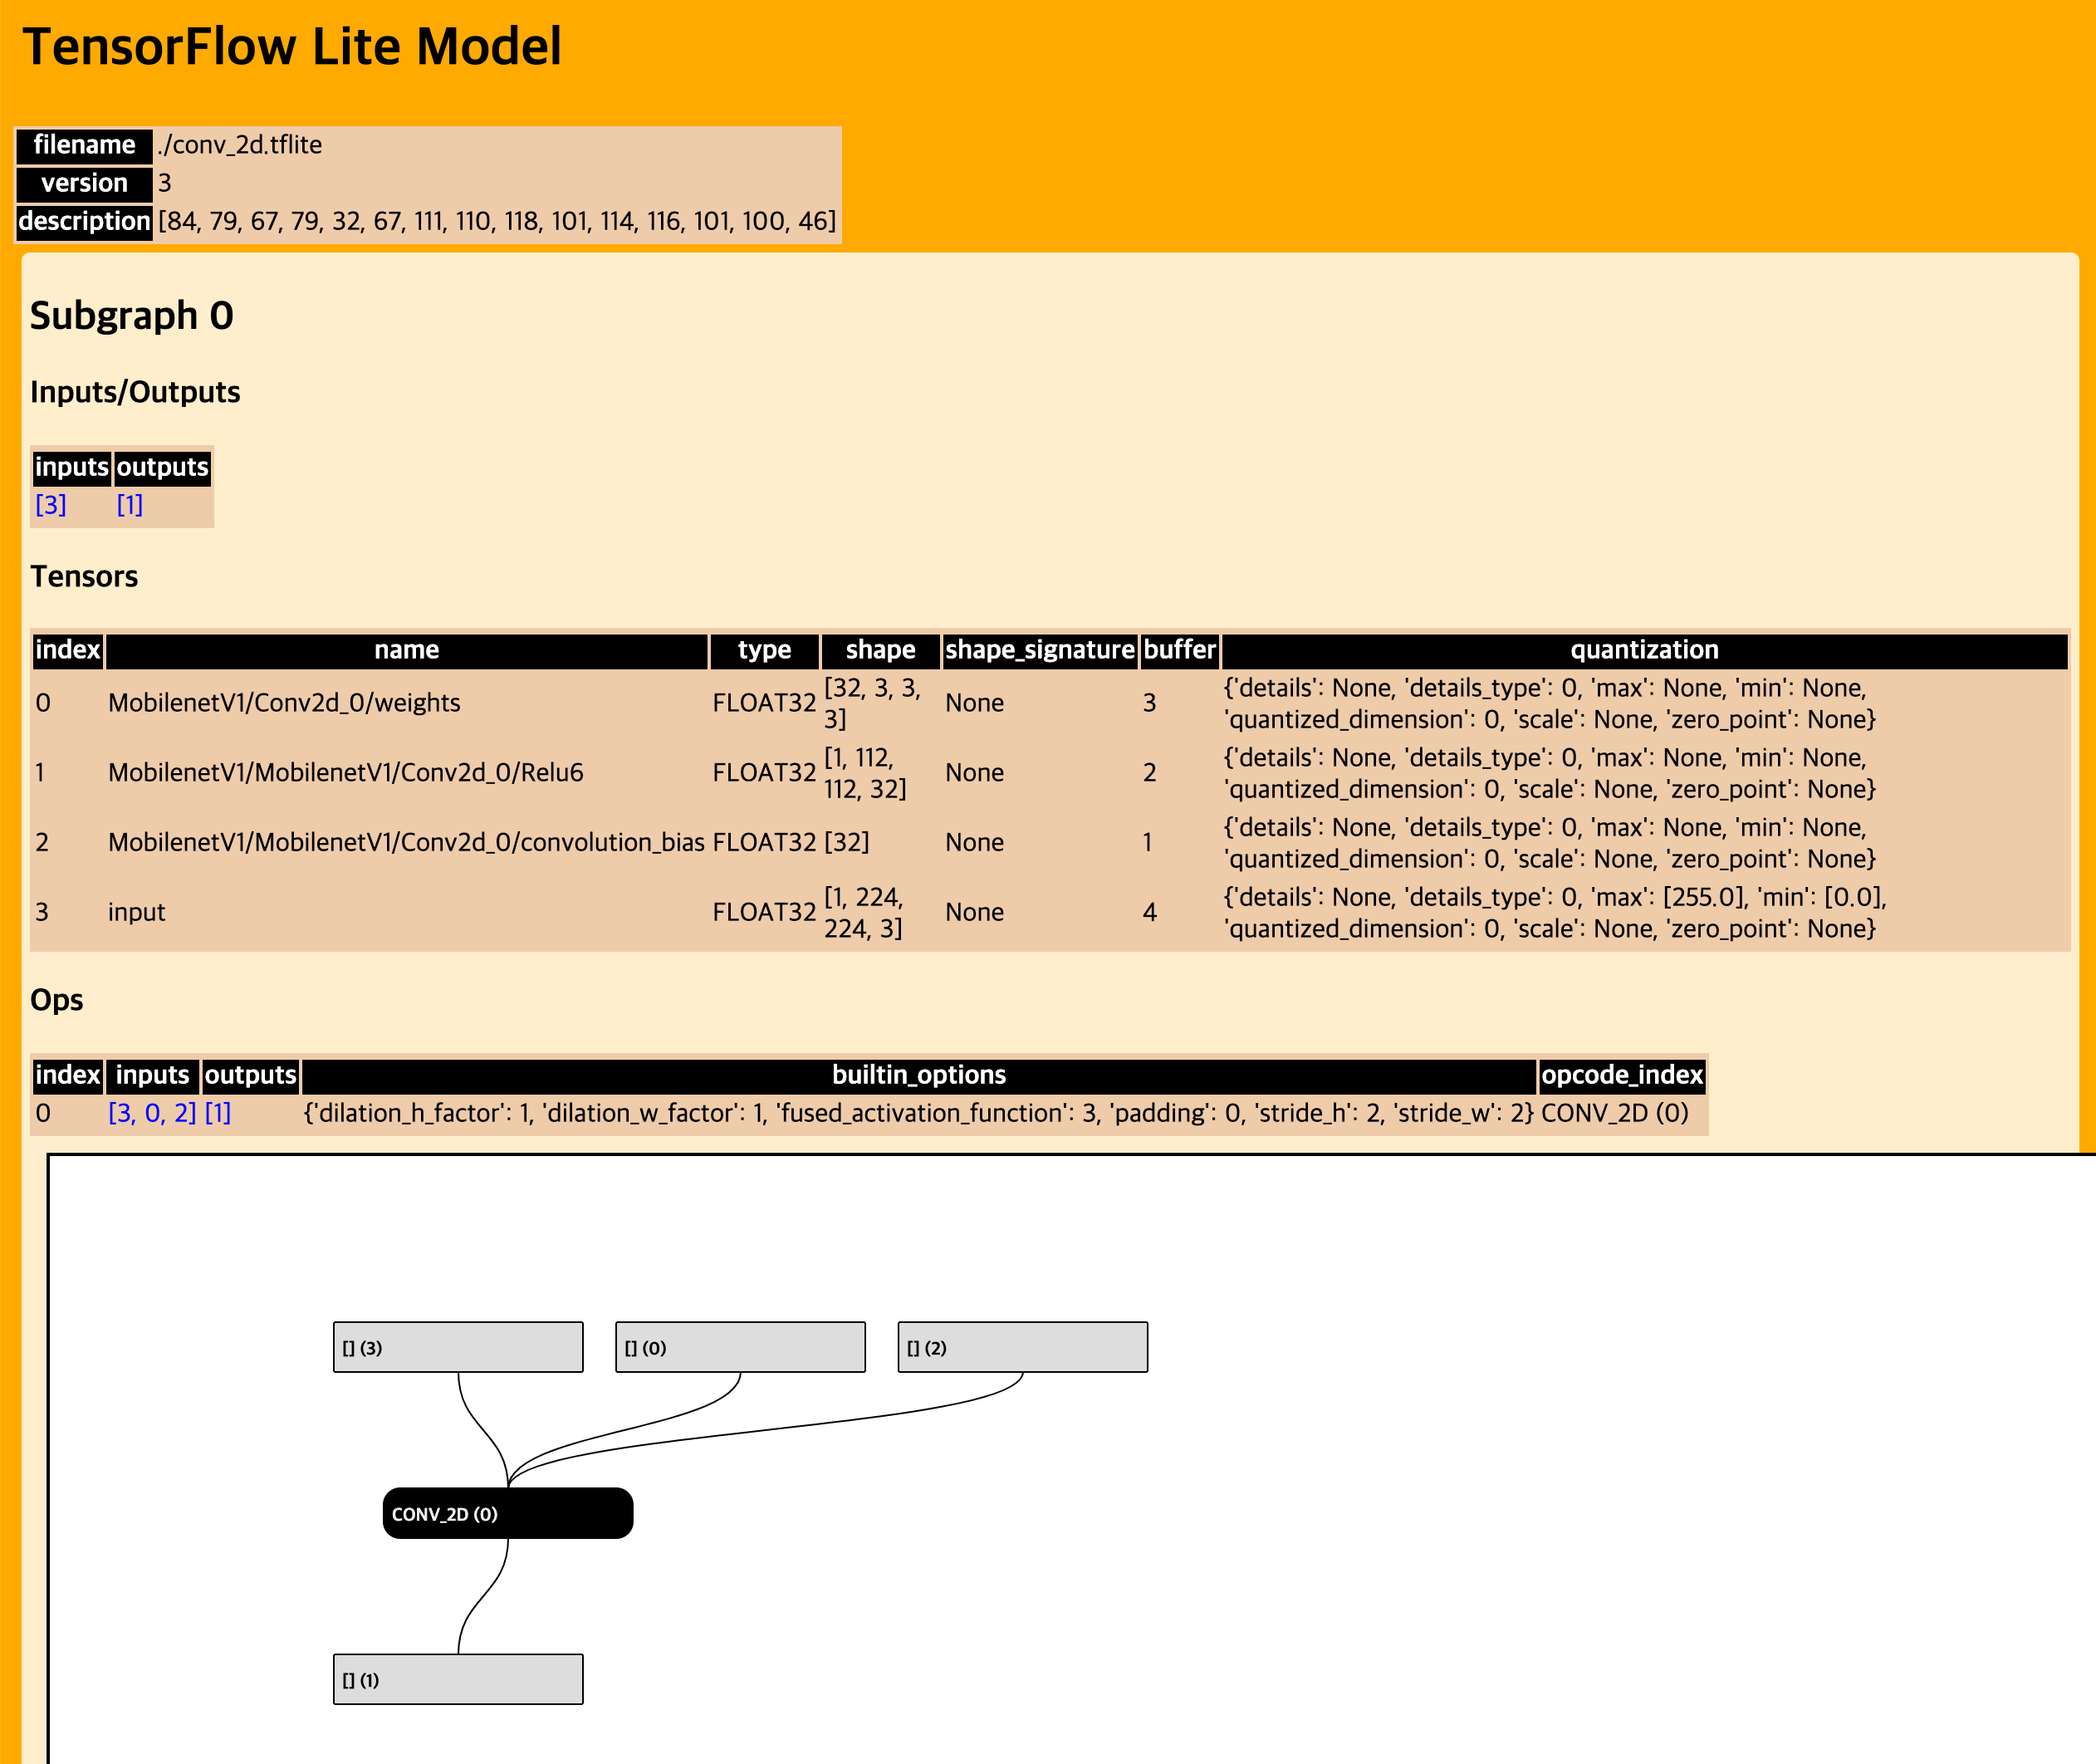
Result of the visualization.py from tensorflow, which is mentioned before in our slack channel.